Leschi Elementary in Seattle’s Leschi/Madrona Neighborhood
When you have not been into a 4th grade classroom for quite a while, you can be thoroughly intimidated by the depth of thinking possible for kids so young. When I walked into Katy’s class at Leschi elementary I thought I knew how to handle kids. And I do but I’m not as good as I thought I was. So I went in thinking I would have a certain set of questions and after spending time in their environment, watching them teach each other WASL math, move from learners to teachers and “turn and talk” I knew my original plan wouldn’t work. So I punted. Following is the account of my 30 minute visit and 10 minute talk to these engaging students starting with some statistics on the neighborhood, the school and then my interview results.
Leschi elementary is located on the border of the Central District in Seattle’s Leschi/Madrona neighborhood. Originally surrounded by working class modest homes the neighborhood has undergone a fairly significant change over the past 15 – 20 years. To get a picture of the two I’ve created a simple table of information I think is interesting. I included information on both neighborhoods to illustrate the difference a few thousand dollars can make.
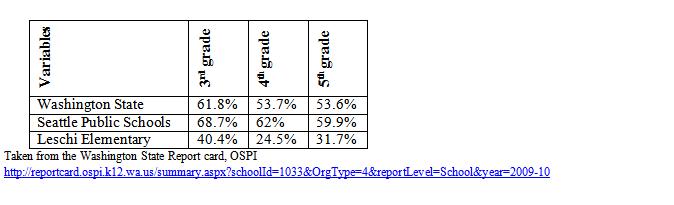
Leschi school is not reflective of the neighborhood surrounding it. As of May2010 they reported 68.3% of their students as Black and 14.7% as White. Seventy three point three percent of their students are on free or reduced-price meals, 11.5% special ed. and 17.3% are transitional bilingual. What is particularly interesting to me and the reason why I visited was to gage one class of students interest and instruction in math. According to their 2009-10 MSP tests 40.4% of 3rd graders, 24.5% of 4th graders and 31.7% of 5th graders have met the standard for math. This is considerably lower that the district where 68.7% of 3rd graders, 62% of 4th and 59.9% of 5th graders have met the standard in the Seattle Public schools. Again let’s compare Leschi against other Seattle Public Schools and the State of Washington scores.
So my expectations were not low nor were they neutral. I go in thinking school with a history of poor test scores, students not transitioning into highly competitive programs, parents association (PTA) historically non-existent. So I walk into this class of what, 27 kids, ALL of them with brown faces. One of the brown faces wasn’t African or African American but he wasn’t white either. From the minute I walk in they are engaged, working in groups or individually, on task and on point. There was a notable absence of unproductive chatter and unnecessary movement. This class moved my perception from neutral to positive.
So I get to watch these students figure out the area of shapes using L x W on shapes that look like a capital T, dividing the illustration into two smaller rectangles and making it work. Great. They’re smart and creative. Now it’s my turn and I ask them a series of questions that I’ve pulled out of nowhere. Not the way we’re supposed to conduct an interview but it’s the best I could do. I’m going to talk about the ones that I really came to ask and not the ice breakers.
1. What is your favorite subject?
2. Why is it your favorite subject?
3. Who told you were good at it?
4. Are girls smarter than boys at math? Why?
5. Are boys smarter than girls at math? Why?
6. How do you get better at math?
7. What do you want to be when you grow up?
Now I told the students I would take notes because I’m old and I don’t remember much, but I forgot to take notes so this is what I remember as striking.
1. What is your favorite subject?
This ran the range of lunch, recess, PE, Language Arts, Reading and at least 6 girls and boys saying Math.
2. Why is it your favorite subject?
The best response was predictable, “because I’m good at it.” But other responses were because they liked it or it was fun.
3. Who told you were good at it?
Most of the students said their mother, father, parents or other family members. At least three students said themselves. They had decided they were good and they encouraged themselves to be good in their favorite subject. None of the kids who said themselves had answered that their favorite subject was PE, Art, lunch or recess. All of them had offered an academic class so they believed themselves to be stars in these subjects. Great self-esteem.
4. Are girls smarter than boys at math? Why?
All but one girl raised her hand and she looked around to see she was alone on this one. What was more interesting is that there were a couple of boys that agreed with them at least until I asked the next question and then they had to support their partners. They girls believed they were smarter because they didn’t waste time on things like video games and sports.
5. Are boys smarter than girls at math? Why?
Not only are they smarter, they don’t worry about things like hair and nails either. They were rock solid convinced BUT I think they knew that if there was a real competition they might lose. This was because one girl suggested we do just that. She said that we should have a math-off competition and the loser would have some consequence – don’t remember what it was but it was good.
6. How do you get better at math?
Every single kid believed that they could get better and it took focus, hard work, paying attention, coming to school, asking questions and doing the best they could. Not one kid believed they couldn’t get better and I didn’t see any evidence of feeling inferior even when I know some of those kids were getting one on one instruction because I saw it.
7. What do you want to be when you grow up?
This was a smokescreen to see if anyone said mathematician. They didn’t. But doctor, lawyer, Indian chief weren’t the only choices either. These students were confident in their ability to be successful because they understood the concept of working hard and being focused. We did talk about what they thought was a distraction to getting their work done and there were a few that responded with predictable answers. The one student that could have said “babysitting” or 19 people in the home raised her hand but when the previous answers didn’t lean that way, I don’t think she was comfortable revealing the chaos in her home either.
So what did I get from this exercise? Teachers matter. The fact that this teacher is a hard core math task master (not really but she expects and gets great results) makes a difference. If you know your subject and can make it engaging (she did), make it fun (she did) and get kids to feel successful (she did) they want to learn and they want to shine. And they did.
Tuesday, May 17, 2011
Sunday, May 15, 2011
Narrative Continued: Background from Other Perspectives
For many years, educators, politicians, and community groups have been attempting to explain and resolve the issue of why minorities, including African American females, struggle in mathematics. This issue is commonly known as the “achievement gap”. Chambers (2009) argues that this term carries with it a negative connotation. It implies that the dominant race of students is superior in some way to the minority students. That is, they are achieving more than the students that are represented by the lower end of the gap. While the education system as a whole preaches on the equality of all students, the label of this disparity places the blame on students, not the education system. The author, in an attempt to refocus the responsibility, suggests another term, the “receivement gap”, to describe this phenomenon. Chambers (2009) states, “The term ‘receivement gap’ is useful because it focuses attention on educational inputs—what the students receive on their educational journey, instead of outputs—their performance on a standardized test” (p. 418). While some authorities may not overtly argue that students should be held responsible to achieve more, the name chosen suggests the existence of a culture within education that excuses itself from taking responsibility of the issue.
Stenson (2006) also recognizes that inequality can be considered as the result of “receivements”, or inputs, not just the individual student. He argues that mathematics education can be better understood not just through the narrow lens of educational research, but also through anthropology, social psychology, sociology, and sociopolitical critique. He references the charts below as a way of considering the different influences that impact African-American’s mathematical achievement. Stenson (2006) maintains that, “… for critical postmodern researchers who are focused on issues of equity and social justice within education, specifically in the mathematics classroom, the critiques of mathematics education become much broader than those that are found within the confines of the students <à teachers <à material technologies (e.g., mathematics curriculum) instructional triangle” (p. 479). Thus, educators who choose not to look beyond their classroom are limited in their ability to meet their student needs.
Tate (2008) gives a specific example of how the lens of sociology could be utilized to examine these varying influences. With the launch of Sputnik, mathematics became a key focus of the United States educational objectives. However, this transformation applied mostly to the “college capable” student, focusing the reforms on only some students and communities. “According to L. S. Miller (1995), educational attainment is a function of the quality of education-relevant opportunity structure over several generations. The pace of educational advancement depends on multiple generations of children attending good schools. Thus, reform efforts targeted for students perceived as college capable merely accelerate the intergenerational resource value-added of largely White, middle-class, suburban students deemed college ready (Shapiro, 2004). This is not to say these students should be denied opportunity structures, such as high-quality teachers; rather, it indicates the importance of providing qualified teachers to less affluent communities and demographic groups that have been traditionally underserved in mathematics.” (Tate, 2008,p. 954). By looking at the mathematical success through this larger social construct, more influences that impact the African-American mathematics student become apparent.
In addition to understanding this issue from a sociological perspective, an economic perspective can also be considered. Banks (2008) explains that as this country grows more and more diverse, higher percentages of the student body will be minority students. Eventually, this higher percentage will translate to a higher percentage in the workforce, an arena where problem-solving and critical thinking are imperative. Banks (2008) predicts that, “If these labor trends continue, there will be a mismatch between the knowledge and skill demands of the workforce and the knowledge and skills of a large proportion of U.S. workers.” Thus, the dilemma of minorities ill-equipped for the jobs of today and tomorrow because of their lack of mathematics skills could be an important economic consideration.
References
Banks, J. (2008). An introduction to multicultural education. Boston: Pearson.
Chambers, T. (2009). The "Receivement Gap": School Tracking Policies and the Fallacy of the "Achievement Gap". Journal of Negro Education, 78(4), 417-431.
Stinson, D. W. (2006). African American Male Adolescents, Schooling (and Mathematics): Deficiency, Rejection, and Achievement. Review of Educational Research, 76(4), 477-506.
Tate, IV, William F. 2008. "The Political Economy of Teacher Quality in School Mathematics: African American Males, Opportunity Structures, Politics, and Method." American Behavioral Scientist 51, no. 7: 953-971.
Narrative Continued: Background from the Historical Perspective
When Homer Plessy refused to move from an all-white railroad car to the legally segregated black railway carriage car (1896) he set into motion the Supreme Court case of Brown v. Board of Education of Topeka (1954) 50 years later overturning separate but equal laws and the democratic right to adequate public education for all students. The long battle for academic equality for African Americans still exist today in many forms including stereotype threats (Steele, 1995), lack of culturally relevant pedagogy (Leonard et.al 2010) and segregation called tracking. Knowing that “students won’t learn what they are not taught” (Oakes 1990) the quality of science and mathematics education depends to a very large extent on the capabilities of science and mathematics teachers (Weiss, 1987).
Still the many programs aimed at educating all students have left women and minorities behind. Women’s education was initially confided to the three c’s – cleaning, cooking and child-rearing (Noelle 2010) and it wasn’t until the end of the 1700s that grammar schools allowed girls. These three c’s applied to all women, until the Women’s Movement started in the 1800’s and the Equal Rights Amendment facilitated the escape from traditional societal women roles. Most African American women would have to wait until the Civil Rights Movement to move primarily from domestics to other fields like nursing (my mother) or business owners and entrepreneurs like Lydia Newman (hair brush) .
Women like Patsy Sherman (one of the patent holders for scotch guard) and Grace Hopper (one of the developer of computer language COBOL in 1960 for the Navy) are products of the earlier tenacity of women in history. Gloria Conyers Hewitt was the 7th African American woman to earn her Ph.D. in math from the University of Washington. History has not been celebratory of these women and they are not held up to the light the same as their male or White (in the case of Hewitt) counterparts.
Knowing that with encouragement, access, highly qualified teachers and institutional support women, especially African American women can be successful in math and any other discipline we move toward why this problem exists.
References
Leonard, J., Brooks, W., Barnes-Johnson, J., & Berry, I. I. I. R. Q. (May 01, 2010). The nuances and complexities of teaching mathematics for cultural relevance and social justice. Journal of Teacher Education, 61, 3, 261-270.
Noelle, K. (2010) The history of women’s education in America. http://www.ehow.com/about_6729065_history-women_s-education-america.html
Oakes, J. (1990) Multiplying inequities: The effects of race, social class, and tracking on opportunities to learn mathematics and science. Santa Monica, CA: The RAND Corporation.
Steele, C. M., & Aronson, J. (January 01, 1995). Stereotype threat and the intellectual test performance of African Americans. Journal of Personality and Social Psychology, 69, 5, 797-811.
Summary of Brown v. Board of Education of Topeka, 347 U.S. 483, 74 S. Ct. 686, 98 L. Ed. 873 (1954)
Weiss, I. (1987) Report of the 1985-86 National Survey of Science and Mathematics Education. Research Triangle, NC: Research Triangle Institute.
Narrative Continued: The Controversy
The consensus that African American girls are inferior in mathematics has been persistent in our society. This internalized conception has conditioned them to believe they are not built to be math literate and are lacking the ability to enter fields and careers that are math based (Leonard 2010). There have been various explanations including a history of race issues, uneven parental influence, intellectual differences, or shortage of high-quality teachers and schools (Oakes 1990).
We have witnessed girls tracked into the lower, less challenging math classes early on thereby diminishing their access to higher level classes in high school. As we continue to move toward greater and greater computer literacy, we also must require high level of critical thinking skills to fill the future needs of technology and science (Oakes 1990). Critical thinking skills can be taught and in our experience, math is one subject that does that very well.
Between the ages of 10 and 18, adolescence males and females move through cycles of change. As they are working on differentiation of their in and out groups they are also working on their self-identity (Tajfel 1982) and place in the social order (Evans 2010) . During this time adolescence girls have an even harder time maintaining their self-esteem (Kusimo 1997). When you add on the challenge of identity creation to the minefield of the teenage years, its’ no wonder there are challenges. Girls have been led to believe that males are better than girls in math and have verbalized this belief in a study of girls in transition (Kusimo 1997).
Evans, A. B., Rowley, S. J., Copping, K. E., & Kurtz-Costes, B. (April 01, 2011). Academic self-concept in Black adolescents: Do race and gender stereotypes matter?. Self and Identity, 10, 2, 263-277.
Kusimo, P. S., & Appalachia Educational Lab., Charleston, WV. (1997). Sleeping Beauty Redefined: African American Girls in Transition.
Leonard, J., Brooks, W., Barnes-Johnson, J., & Berry, I. I. I. R. Q. (May 01, 2010). The nuances and complexities of teaching mathematics for cultural relevance and social justice. Journal of Teacher Education, 61, 3, 261-270.
Oakes, J. (1990) Multiplying inequities: The effects of race, social class, and tracking on opportunities to learn mathematics and science. Santa Monica, CA: The RAND Corporation.
Tajfel, H. (1982). Social identity and intergroup relations. Cambridge [Cambridgeshire: Cambridge University Press.
We have witnessed girls tracked into the lower, less challenging math classes early on thereby diminishing their access to higher level classes in high school. As we continue to move toward greater and greater computer literacy, we also must require high level of critical thinking skills to fill the future needs of technology and science (Oakes 1990). Critical thinking skills can be taught and in our experience, math is one subject that does that very well.
Between the ages of 10 and 18, adolescence males and females move through cycles of change. As they are working on differentiation of their in and out groups they are also working on their self-identity (Tajfel 1982) and place in the social order (Evans 2010) . During this time adolescence girls have an even harder time maintaining their self-esteem (Kusimo 1997). When you add on the challenge of identity creation to the minefield of the teenage years, its’ no wonder there are challenges. Girls have been led to believe that males are better than girls in math and have verbalized this belief in a study of girls in transition (Kusimo 1997).
Reference
Evans, A. B., Rowley, S. J., Copping, K. E., & Kurtz-Costes, B. (April 01, 2011). Academic self-concept in Black adolescents: Do race and gender stereotypes matter?. Self and Identity, 10, 2, 263-277.
Kusimo, P. S., & Appalachia Educational Lab., Charleston, WV. (1997). Sleeping Beauty Redefined: African American Girls in Transition.
Leonard, J., Brooks, W., Barnes-Johnson, J., & Berry, I. I. I. R. Q. (May 01, 2010). The nuances and complexities of teaching mathematics for cultural relevance and social justice. Journal of Teacher Education, 61, 3, 261-270.
Oakes, J. (1990) Multiplying inequities: The effects of race, social class, and tracking on opportunities to learn mathematics and science. Santa Monica, CA: The RAND Corporation.
Tajfel, H. (1982). Social identity and intergroup relations. Cambridge [Cambridgeshire: Cambridge University Press.
The Narrative: An Introduction
As women with different success in the field of mathematics, my partner and I are personally invested in what are some of the reasons why this is the case. One of us is attached to the cultural and racial stereotype of African American women and the other was raised in an environment satiated with mathematicians and academic encouragement. This dynamic has made for interesting research collaboration. When researching the topic we specifically we wanted to answer the question “Why are African American females not successful in mathematics?” This led us to ask subsequent and larger questions of why are African Americans not successful in mathematics and more specifically why are females not successful in mathematics?
There are always different voices and motives in any social change with perspectives shaped by their wants and experiences. As the racial stereotypical member of this blog, I experienced math phobia and the assumptions tied to my race and cultural. The experiences of the African American girls in the Voices project (Kusimo 1990) were my experiences. My support as a math student did not come from home like Kimberley Weems and unlike my partner in this project, my parents did not work in the science or math fields nor was math recognized as an important part of my daily life. It was more valuable to my parents that I kept my skirt down and panties up than increasing my math abilities. Cartoons were my babysitter and there were no books in my home outside of the ones I borrowed from the library.
With the recoloring of America and the traditional pool of scientific works shrinking (young white males), interest in promoting and growing math and science students is being initiated and funded by many different groups. MESA USA (Mathematics, Engineering, Science Achievement Program) operates in eight states supporting high school co-curricular and summer opportunities for disadvantaged and underrepresented students go on an attain math-based degrees. Colleges have created programs to attract and keep African American students especially in STEM programs. Kennesaw State University not only has the Office of Minority Student Retention but also a mandated Minority Advisement Program with Minority Recruitment Officers http://www.kennesaw.edu/stu_dev/msrs/. Bowling Green State University has a 4-year undergraduate program summer bridge program preparing students to succeed academically in STEM fields. Targeted at women and underrepresented minorities the successful summer graduates are awarded stipends from $1,000 to $1,500 all four years if they remain in “Good Standing.” The AIMS program at Bowling Green University requires their students to study leading to a bachelor’s degree in STEM related fields or teacher education with a focus in these areas. Students can receive up to $42,000 per year over 5 years to stay in this much needed field. http://www.bgsu.edu/downloads/provost/file49712.pdf. Believing that these schools are participating for purely altruistic reasons is naive yet the schools get to increase the number of women and minorities in the field and regardless of the reason, the outcome is desirable.
As we look into the different views, perspectives and struggles, we hope to find more than finger pointing but workable solutions, good sources of usable information and hope for all students of color but especially African American girls.
Kusimo, P. S., & Appalachia Educational Lab., Charleston, WV. (1997). Sleeping Beauty Redefined: African American Girls in Transition.
Reference
Kusimo, P. S., & Appalachia Educational Lab., Charleston, WV. (1997). Sleeping Beauty Redefined: African American Girls in Transition.
Saturday, May 14, 2011
US Department of Education
As we look at the national pattern of students prepardness for higher education in mathematics, we found data confirming the gap between African Americans students and students of other ethnicities.
Using IES National Center for Education Statistics, the chart above indicates the gap that still exist today.
Subscribe to:
Posts (Atom)